Simplified Excels with MS Graph API
A brief intro on a fresh way to work with excel file
Introduction
Today I want to share with you a way to handle Excel files (. xlsx) with the help of the Microsoft Graph API.

I came across this solution during my last job as my team was our method for treating data. To be clear we needed to read data from excel file coming from a macro during this transition phase I needed to have a fast and temporary.
I wanted to write this article because I haven't found any covering this solution. I will firstly get you started with the API quickly, then we'll see a real world application.
Stick to the end there is a bonus paragraph.
Now let's get started.
The MS Graph API
Requirements
You'll firstly need a Miscrosoft account in order to use the Microsoft Graph API.
- Login to your account and go on the Graph Explorer.
This interface is designed to let you play with the API so go ahead play with it and come back when you want !
For those who stayed/came back starts by uploading a file to your personnal space.
Now we will firstly get to the api point to go to your drive.
If you have any trouble understanding remember the documentation exits and it's here.
I'll recommend you to access to your drive space this way as I found it was kind of sketchy and non-working sometime.
You see you can retrieve your file using this access point.
https://graph.microsoft.com/v1.0/me/drive/items/{drive-item-id}/workbook/worksheets/Sheet1/tables
You also have the basic that the graph explorer to see what you can do with it.
Real World Application
In which case you can come to use it
As you know a lot of people still uses excel files as it is the generally used way to organize data so if you have to automate some part painlessly.
Indeed this solution can be used for personnal use but also in small business or in startups environnements.
I will showcase it in this very article.
Case-Study
A small business needs your help.
Here is the problem, They currently use spreadsheet to register all the purchases and they want to add the online purchases as it is painful to write them by hand and error prone.
We will make simple choices as it as simple request.
As a good programmer we will breakdown the bigger task into smaller tasks here is how :
- Retrieve the excel file
- Retrive the online purchase
- Add them to the file
- Display it in a interface
I strongly recommend you to clone this boilerplate as we are gonna use it a lot here.
What it does ? It handles all the login with 0auth 2.0 and MSAL object configuration. It basically gets you started without writing all the authentification logic by yourself. If you want to learn more the officials tutorials repos are here.
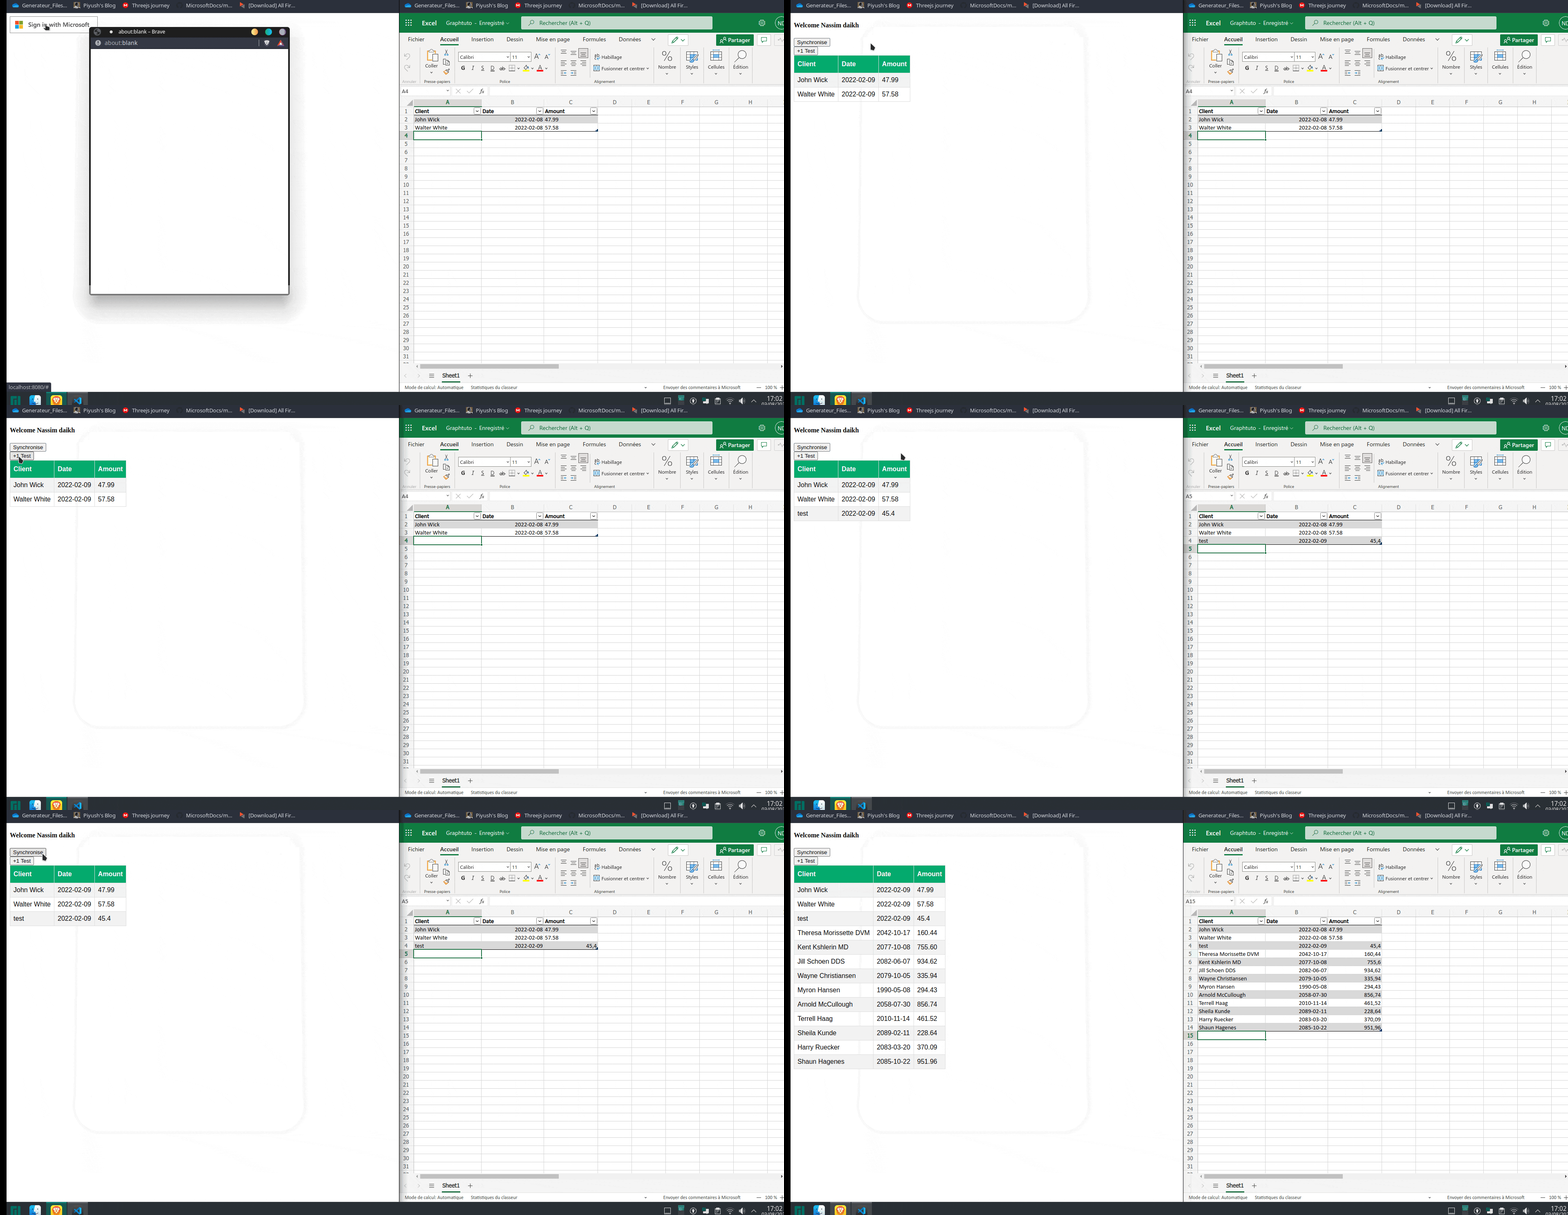
You will start by having a button which allows you to login and then display your name.
1. Retrieve the excel file
You can download the example file here.
Firstly, we need to retrieve the data from the excel. Basically, we could just download it we will do something smarter by leveraging the power of the MSGraph API.
A table is :
- Header
- Body
We will retrieve the header as such :
async function getTableHead() {
    let headers = []
    // Loop in order to get the head of the table
    for (var i = 0; i < 3; i++) { // i< 3 as our table has 3 columns
        let endpoint = ExcelPath + `cell(row=0,column=${i})`;
        let col = await graphClient
            .api(endpoint)
            .get()
            .then((res) => {
                return res.text.flat(); // Get the text of the cell
            }).catch((err) => {
                console.log(err);
            });
        headers.push(col);
    }
    return headers.flat(); // Return the array of the headers
}
We've used the graph client which allows us to call the api with a much more clean calls and some fews useful methods.
Then we retrieve the table body :
async function getTableBody() {
    let endpoint = ExcelPath + 'tables/Table_1/rows'; // This endpoints retrieves all rows EXCEPT the head
    return await graphClient
        .api(endpoint)
        .get()
        .then((res) => {
            return res.value;
        }).catch((err) => {
            console.log(err);
        })
        .then(
            (res) => {//we clean the api response in order to work with it simply
                let body = [];
                for (var i = 0; i < res.length; i++) {
                    body.push(res[i].values.flat());
                }
                return body;
            }
        )
        .catch((err) => {
            console.log(err);
        });
}
Simple right a call to the api and some treatment because teh api is so complete we have a lot of other stuff that we fetch along.
Beautiful ! You now have retrieved the data back from the spreadsheet
2. Retrive the online purchase
We can assume the shop is probably using stripeapi which is very dense in content so we're not going to cover it here .
For this I am using a the mockapi api which is very useful if you want to simulate fake api datas.
The interface is very simple to use definetly go check it out for the front-end devs that need fake datas for the ui.
So we fetch the data with this function :
async function getPurchaseOrders() {
    return await fetch('https://youtpurchaseorders.com/purchaseorders')
        .then(response => response.json())
        .then(data => {
            // console.log(data);
            data.forEach(element => {
                delete element.id; // We don't need the ids
                element.Date = element.Date.substring(0, 10); //we keep only MM--DD-YYYY format
            });
            return data;
        }).catch((err) => {
            console.log(err);
        }
        );
}
As simple as this !
3. Add data to the spreadsheet
We now need to send row in order for the spreadsheet to have it.
async function postTableRow(row) {
    let endpoint = ExcelPath + 'tables/Table_1/rows';
    return await graphClient
        .api(endpoint)
        .post(row)
        .then((res) => {
            return res;
        }).catch((err) => {
            console.log(err);
        }
        );
}
At this point we can read and write on the spreadsheet. Now let's jump to interface so the user can interact with it.
4. Display it in the interface
We are going to make a very simple interface.
Two simple buttons :
- Syncronize in order to add the online customers to the spreadsheet
- Addtest which is just a bouton to a test customer
Explaining the HTML and CSS doesn't fit this article so I skip the details to go directly to the javascript code.
Our ui.js file has three main functions :
- displayUI
- synchronise
- Addtestvalue
The display Ui function basically hide/show button and table when the user login:
async function displayUI() {
    await signIn();//wait for the user to sign in
    const Tablehead = await getTableHead(); //get the head of the table
    const Tablebody = await getTableBody(); //get the body of the table

    let userName = document.getElementById('userName');
    userName.innerText = user.displayName;

    // Hide login button and initial UI
    let signInButton = document.getElementById('signin');
    signInButton.style = "display: none";
    let content = document.getElementById('content');
    content.style = "display: block";
    // Display the sync button
    let SynchroniseButton = document.getElementById('synchronise');
    SynchroniseButton.style = "display: block";
    // Display the addvalue button
    let addvalueButton = document.getElementById('addvalue');
    addvalueButton.style = "display: block";
    // Display the table
    let table = document.getElementById('table');
    table.style = "display: block";

    for (let i = 0; i < Tablehead.length; i++) {
        let th = document.createElement('th');
        th.innerText = Tablehead[i];
        table.appendChild(th);
    }

    for (let i = 0; i < Tablebody.length; i++) {
        let tr = document.createElement('tr');
        for (let j = 0; j < Tablebody[i].length; j++) {
            let td = document.createElement('td');
            // convert the date to the correct format
            if (j == 1) {
                //check if it's a number
                if (isNaN(Tablebody[i][j])) {
                    td.innerText = Tablebody[i][j];
                } else {
                    td.innerText = excelDateToJSDate(Tablebody[i][j]);

                }

            } else {
                td.innerText = Tablebody[i][j];
            }
            tr.appendChild(td);
        }
        table.appendChild(tr);
    }

}
then the syncronise function:
async function synchronise() {
    const PurchaseOrders = await getPurchaseOrders();
    let table = document.getElementById('table');

    let bodys = [];

    PurchaseOrders.forEach(async element => {
        bodys.push(Object.values(element));
    });
    let rows = {
        values: bodys
    }
    await postTableRow(rows).then(
        () => {
            for (let i = 0; i < PurchaseOrders.length; i++) {
                let tr = document.createElement('tr');
                let keys = Object.keys(PurchaseOrders[i]);
                for (let j = 0; j < keys.length; j++) {
                    let td = document.createElement('td');
                    if (j == 1) {
                        td.innerText = PurchaseOrders[i][keys[j]].slice(0, 10)
                    } else {
                        td.innerText = PurchaseOrders[i][keys[j]];
                    }

                    tr.appendChild(td);
                }
                table.appendChild(tr);
            }
        }
    )
}
And finally the the test function :
async function Addtestvalue() {
    let testrow = {
        values: [
            ['test', '2022-02-09', 45.40]
        ]
    }
    await postTableRow(testrow).then(() => {
        let tr = document.createElement('tr');
        testrow.values.forEach(element => {
            console.log(element);
            element.forEach(e => {
                let td = document.createElement('td');
                td.innerText = e;
                tr.appendChild(td);
            })
        }
        );
        let table = document.getElementById('table');
        table.appendChild(tr);

    });

}
Congratulations ! You have mastered a new way of working with excels.
If you have trouble the github repository is here.
Don't hesitate to leave a react and I will see you in an another article !
Bonus - No-code it
I know No code doesn't get a lot of love from us developpers but sometimes it buys you a lot of time and we know how precious it is.
Disclaimer : I won't be covering the interface with no-code because I don't know but you can probably make one with bubble somehow.
Very simple and straight forward.
You go on Make.com and login (or make(👀) an account)
You get on a scenario (this is the equivalent of a script for devs)
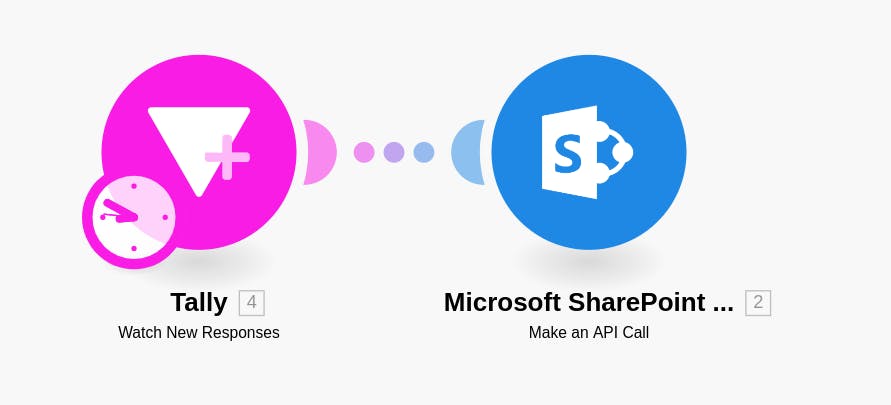
You get a webhook from the online orders
You get a Msgraph module and query it juste like the postTableRow() method.
You configure it that way
And VOILA it adds automatically a row to yout table !
Here what it looks like (very simple).
